Fullcast Targets & Quotas
Role
Lead the research and design efforts for a re-imagining of the targets feature experience from concept to final implementation.
Skills
UX/UI Design
User Research & Testing
Prototyping
Tools
Figma
Figma Make
Pen & Paper
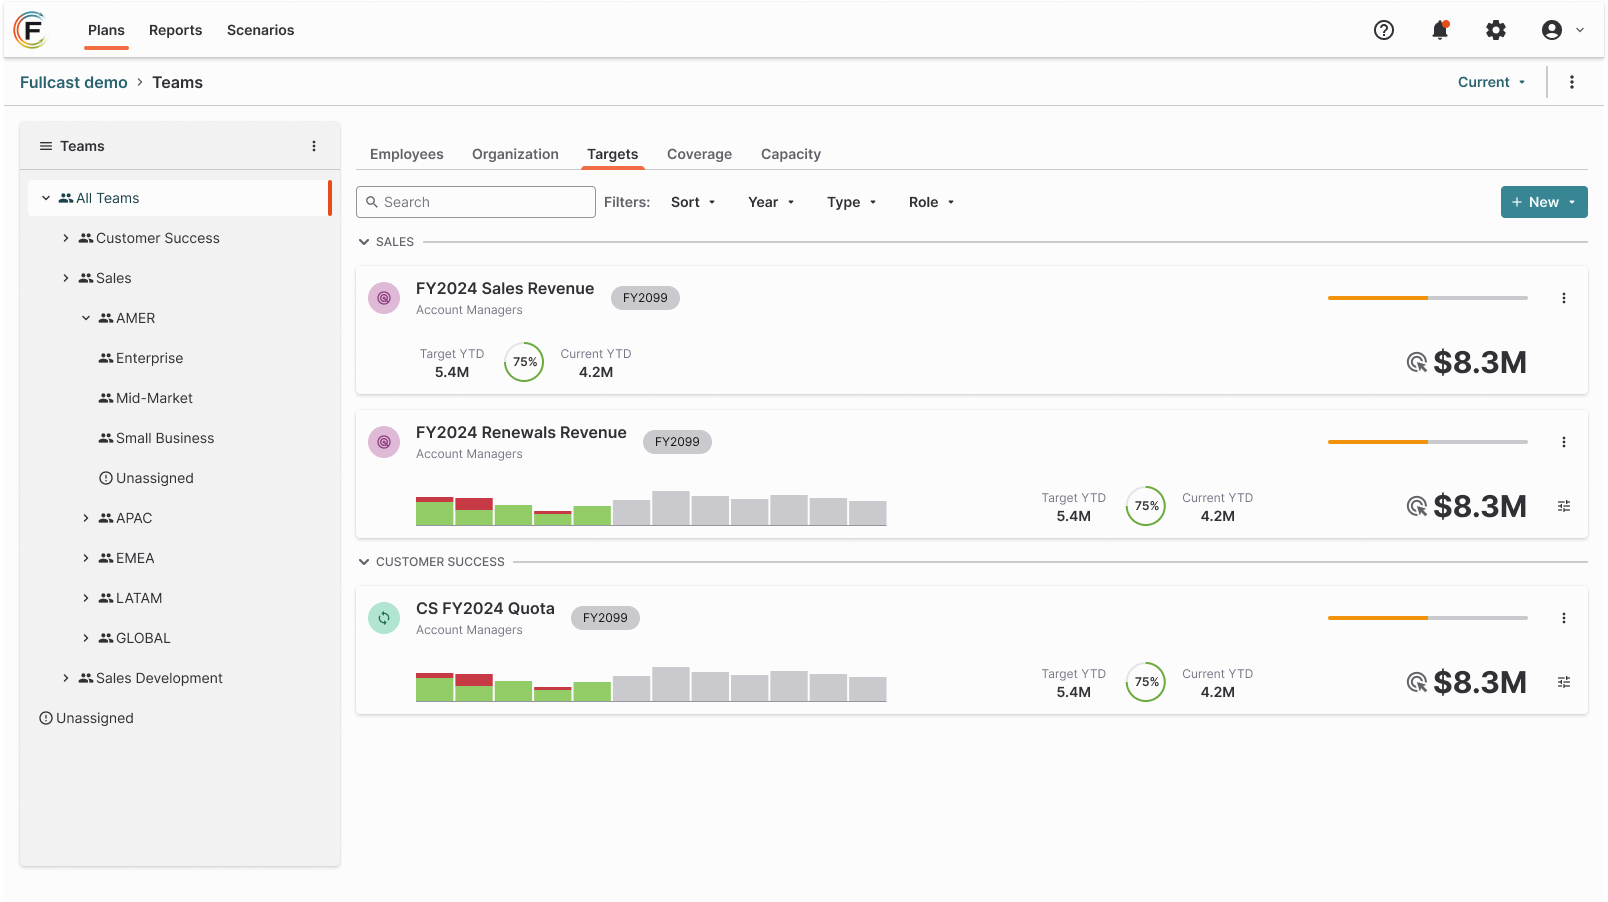
The Problem
The existing targets feature was incredibly hard to navigate to and modify both team and individual targets. It was also difficult to understand what was being affected when those modifications were made, leaving a distinct lack of trust in the feature.
The targets feature was trying to do too many things at once on one screen, with little to no feedback on what was happening to the targets as they were being created or modified. Language within the feature was inconsistent and confusing and the overall hierarchy of information was non-existent.
The Process
The largest users of the feature were interviewed to about the targets feature to help identify key pain-points and address those directly
The combination of top-down and bottom-up distribution functionality was a high friction point, leading to confusion and user-error when editing a target. Often times if multiple users were making changes to the same target individual users didn’t know which distribution method they should use or what was used before.
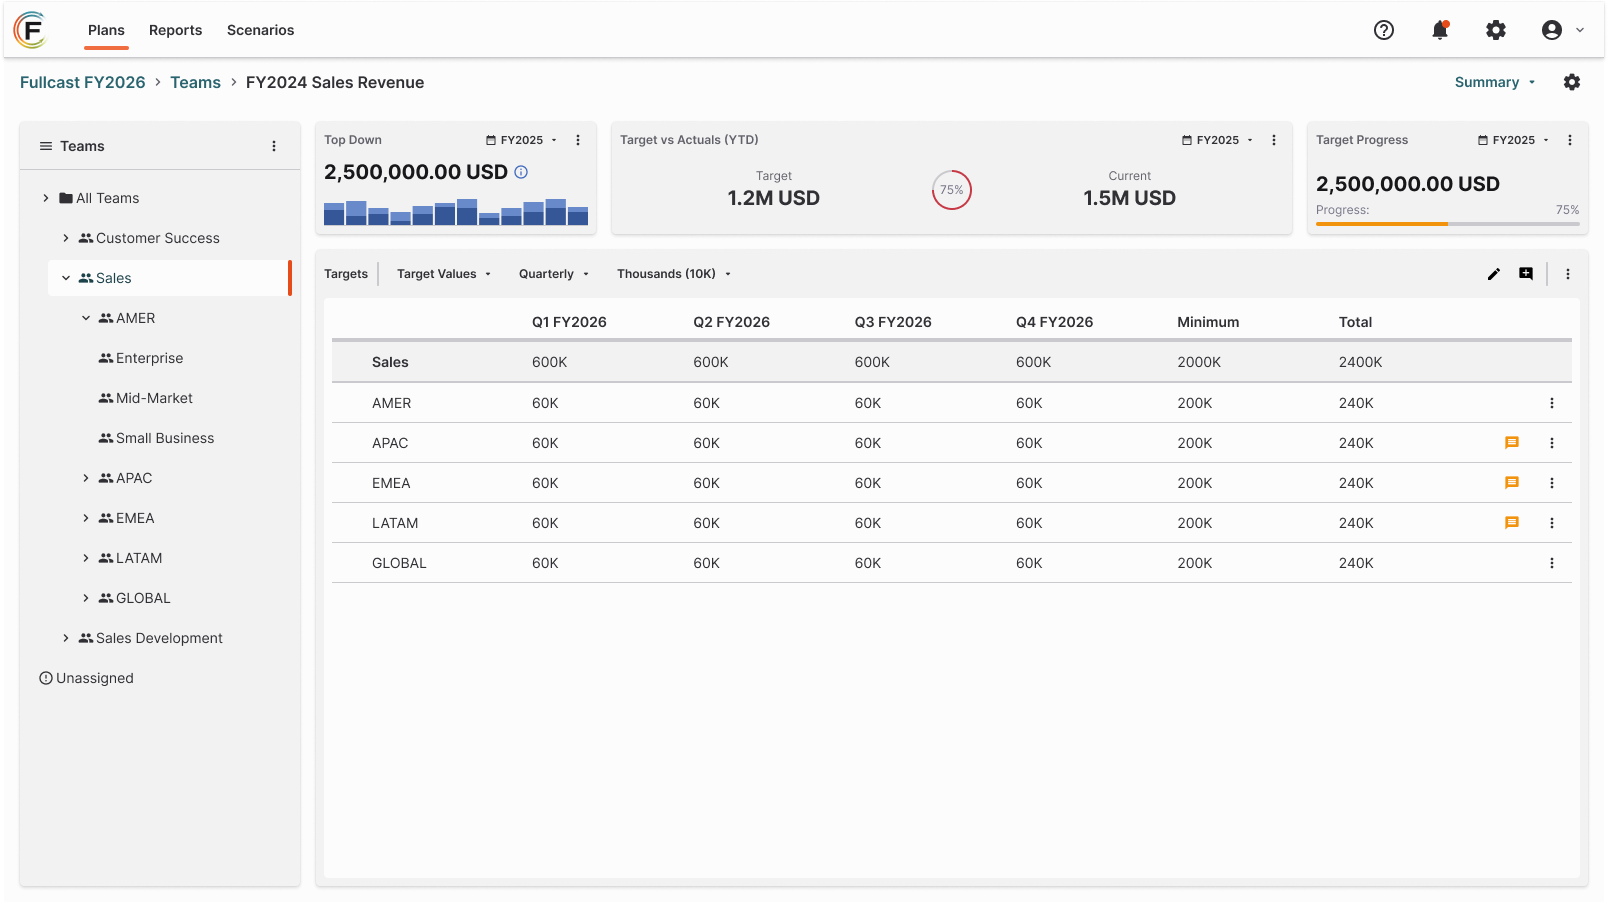
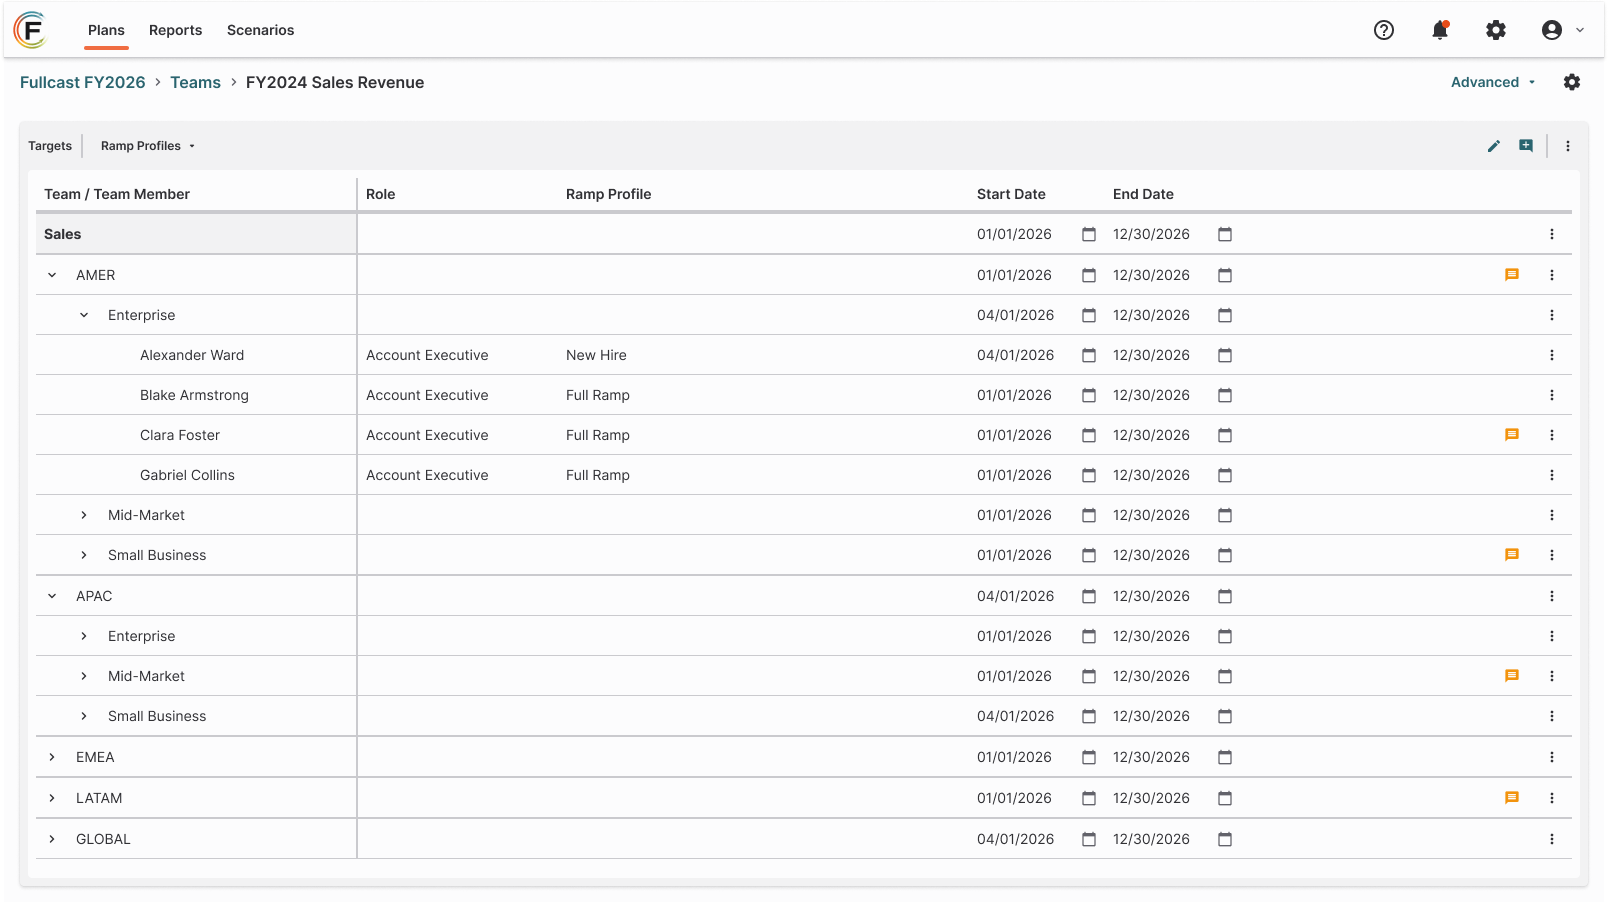
The original details view for targets wasn’t able to easily support a deeper level of information and would send the user to a new page to view specific data at that level, this prevented a user from being able easily to compare different team targets at the same level or view specific data at a higher level.
Being limited to a monthly distribution was another high friction point, often users expressed a need to view quarterly or annual values which wasn’t available in the current version.
The terminology and language across targets was a major complaint amongst the customers interviewed, the terminology was either outdated or did not make sense to our customers.
The Work
We focused on four key pain points for the release and quickly iterated on those ideas
We separated top-down and bottom-up functionality into two distinct target types. This allowed us to simplify the experience for each type of target and reduced the chance for human error.
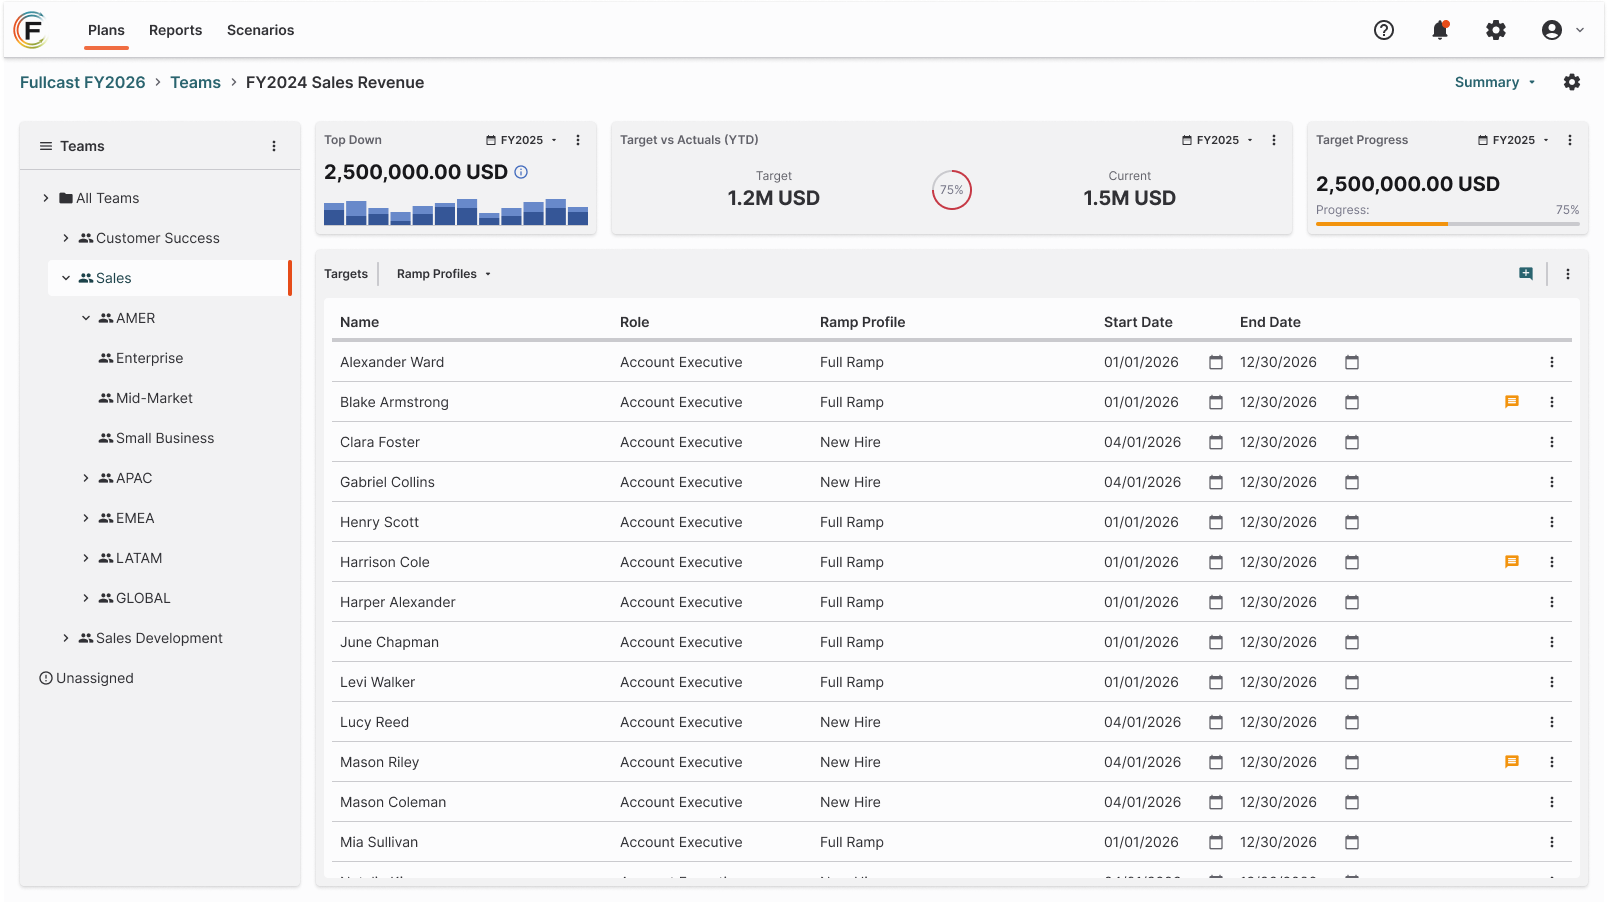
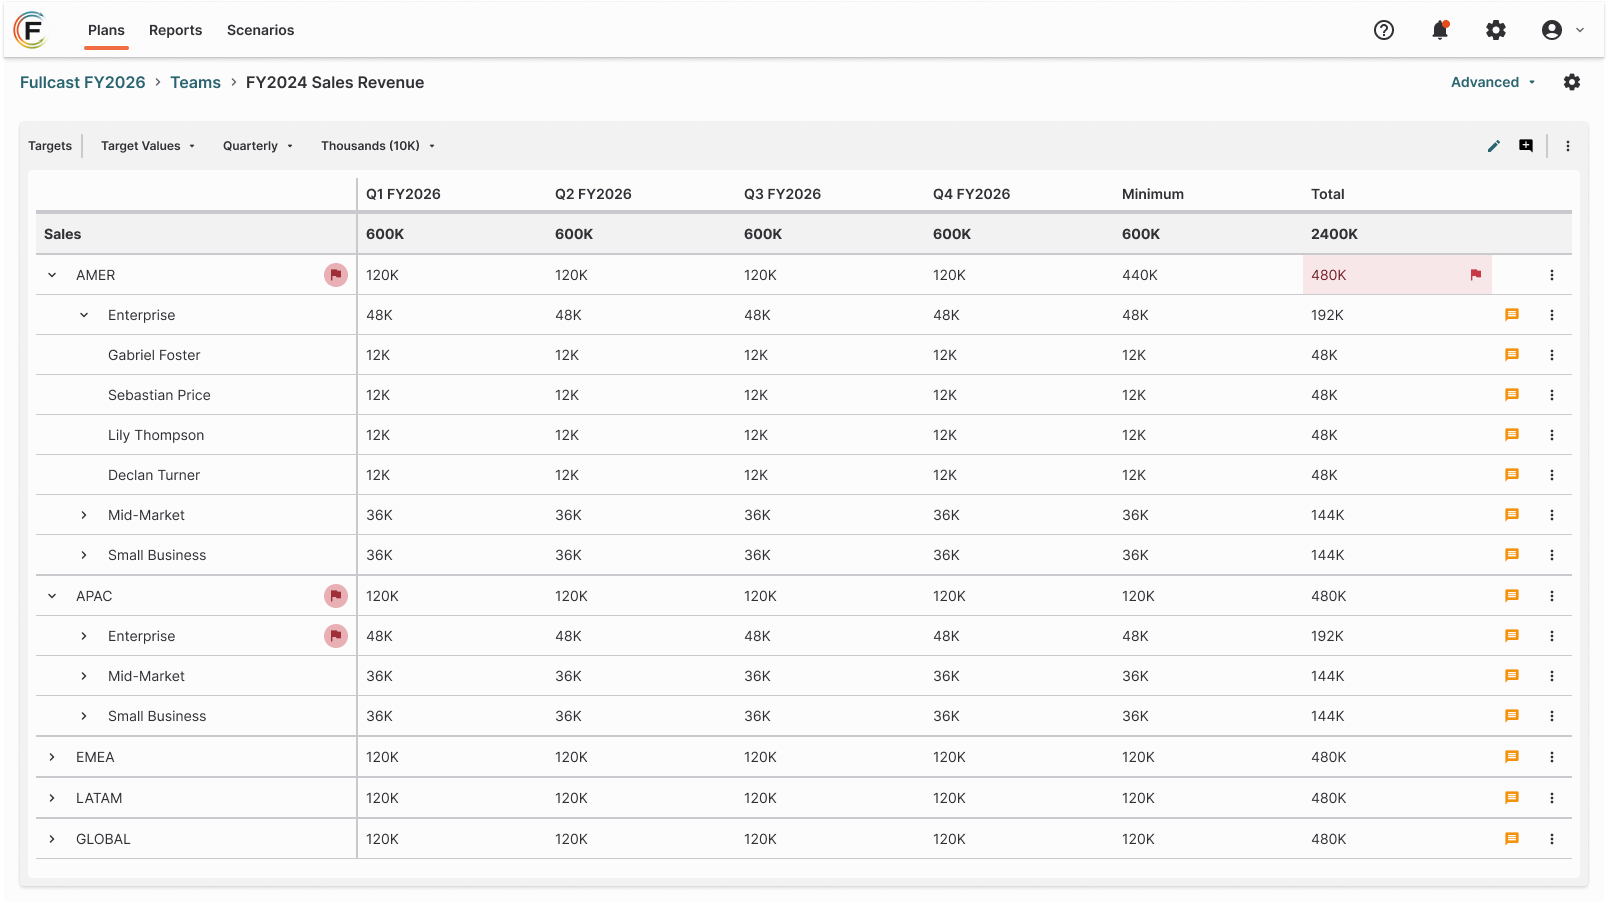
A new “advanced” view of the target details was introduced to accommodate advanced use cases and allow for more customization of the data grid, including the ability to add preset and custom metrics like minimum quota. As well as the ability to look at monthly, quarterly and annual breakdowns of the target information.
The original view was also updated with the ability to look at monthly, quarterly, and annual target breakdowns as well as view a more limited set of preset metrics.
Language across the experience was audited and brought in-line with more modern terminology used in the revenue operations space.
The Result
Overall positive reviews with existing customers during the beta testing, citing an easier to understand interface and information hierarchy, better labeling and ability to complete specific workflows.
Adoption rates had increased amongst existing customers by 25% and 50% for new customers.
Several requests had been made for the ability to compare similar targets whether across plans or scenarios and is being explored for a future update.